Products / MARC Light Collector
The laboratory reference for characterizing curing lights.
The MARC Light Collector resolves both halves of a cure: the dose a curing light delivers at the surface of a specimen, and the energy that passes through it. It measures absolute radiant power by wavelength from visible to infrared, and, with a specimen in the sample compartment, the transmitted energy at the bottom sensor. It is a NIST-traceable laboratory instrument, independently benchmarked against a laboratory integrating-sphere gold standard (adjusted R² above 0.99), and used in peer-reviewed dental research.
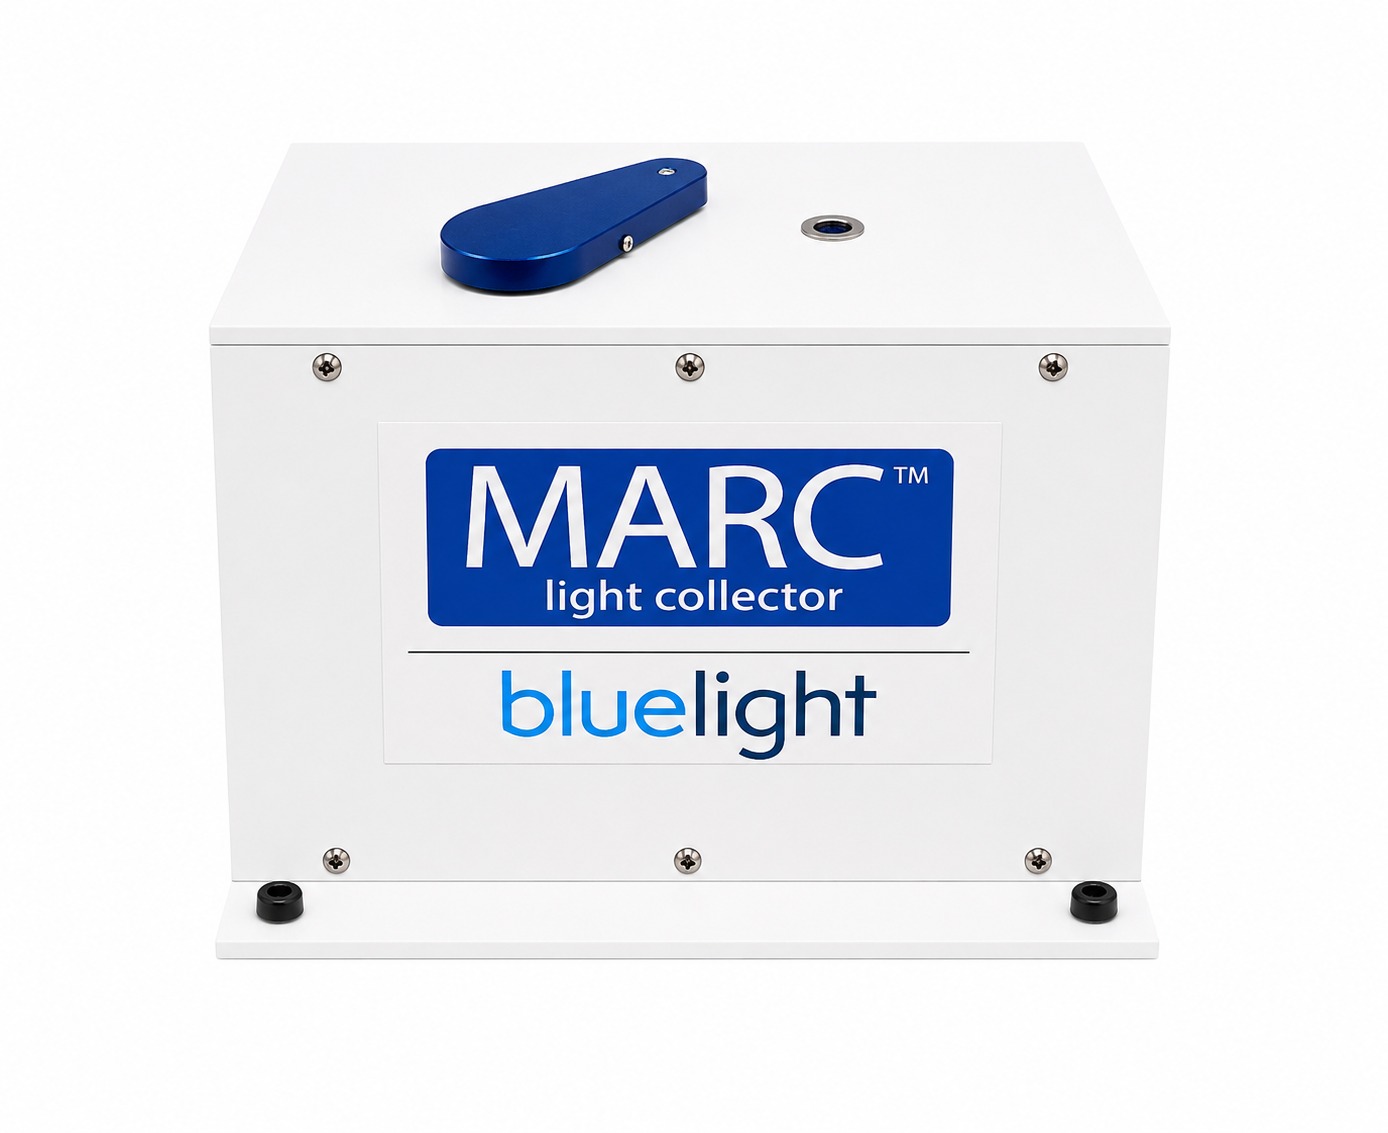
- 350 to 1,000 nmSpectrally resolved, visible to infrared
- NIST traceableTo the standard, across the range
- ISO 10650:2026Radiometric test methods supported
- 200+Publications involving the MARC platform
See it measure
Thirty seconds on the bench.
The instrument and its software, measuring a real cure: the full spectrum from visible to infrared, dose set at the surface, transmittance read at the bottom sensor, the whole cycle recorded.
MARC-LC · the software measuring a cure · 30 s
Talk to the research teamWhy it exists
Six ways a curing-light study goes wrong before it starts.
Delivered energy is not a property of the light alone. It moves with distance, geometry, battery, and the material in the path, and a single lumped number hides all of it.
Delivered energy changes sharply with distance, angle, and tip position.
Beam output is spatially non-uniform: violet and blue can sit in different zones.
A light's output drifts over its lifetime and as its battery drains.
Pulling many lights, modes, and specimens into one analysis is laborious.
A lumped irradiance number hides whether a specific initiator got enough energy.
Measurements need traceable calibration and settings to hold up in review.
The instrument
Four laboratory subsystems, integrated into one box.
What usually takes a sphere, a bench spectrometer, and a rig of fixtures is one calibrated enclosure, so every measurement shares the same geometry, the same traceability, and the same dataset.
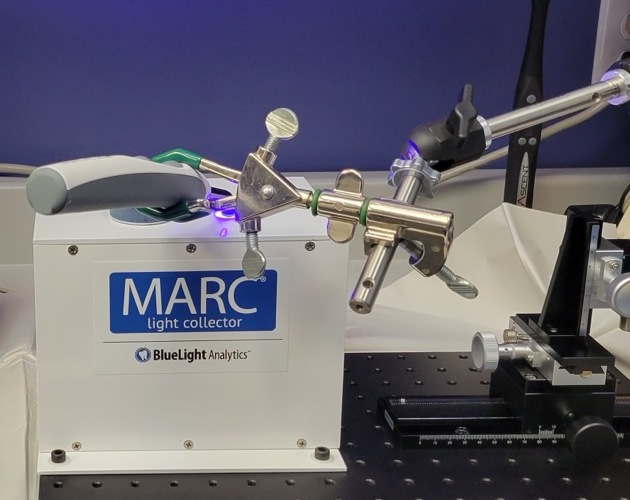
The blue drawer holds a composite or ceramic specimen (Delrin rings at 1, 2 and 3 mm, nine apertures from 3 to 11 mm, and a composite-tooth clinical proxy), while the bottom sensor, behind a fixed 4 mm aperture with its own calibration, reads the energy transmitted through it.
A 16 mm cosine-corrected collection port with interchangeable apertures accepts turbo and wide curing-light tips and feeds the sphere: the light's own spectrum and radiant power, characterized directly.
Inside: total-flux, cosine-corrected collection, the geometry behind the radiometric test methods in ISO 10650:2026, and the reason integrating-sphere measurement is the accepted laboratory approach.
An Ocean Optics SR4 (USB4000 on earlier units) resolves emission by wavelength across 350 to 1,000 nm, with integration times from 3.8 ms to 10 s. Instrument calibration is NIST-traceable.
What it resolves
Energy where the chemistry needs it.
A 2026 study of eight multi-peak curing lights found blue-to-violet power ratios ranging from 3:1 to 30:1, and violet attenuated ~98% through 4 mm of composite. Which band carried the energy, and how much survived the material, is exactly what a lumped number can't say.
Declare the material's photoinitiators (CQ, TPO and Ivocerin), and MARC-LC reports the radiant exposure delivered into each one's absorption band. A blue-heavy source can read "bright" on a radiometer yet deliver little energy where a violet-absorbing initiator absorbs. For materials R&D, the spectral match is the quantity a formulation actually depends on.
Capture is auto-triggered by a configurable power threshold, so the record spans exactly the light-on window. Irradiance is measured across the whole exposure and integrated into radiant exposure (the dose, in J/cm²), split into violet and blue band energy, at the distance and geometry of your study. With a specimen in the compartment, the same capture reads what actually arrives at the bottom.
Ratio and attenuation findings: Maucoski, MacNeil, Gonzales Guarneri, Labrie & Price, Journal of Dentistry, 2026 · charts stylized
Inside the software
Capture, analyze, and compare in one workbench.
The instrument and the software are built together: a native desktop app for macOS and Windows that drives every capture, keeps the raw record, and syncs it, offline-first, to secure cloud storage.
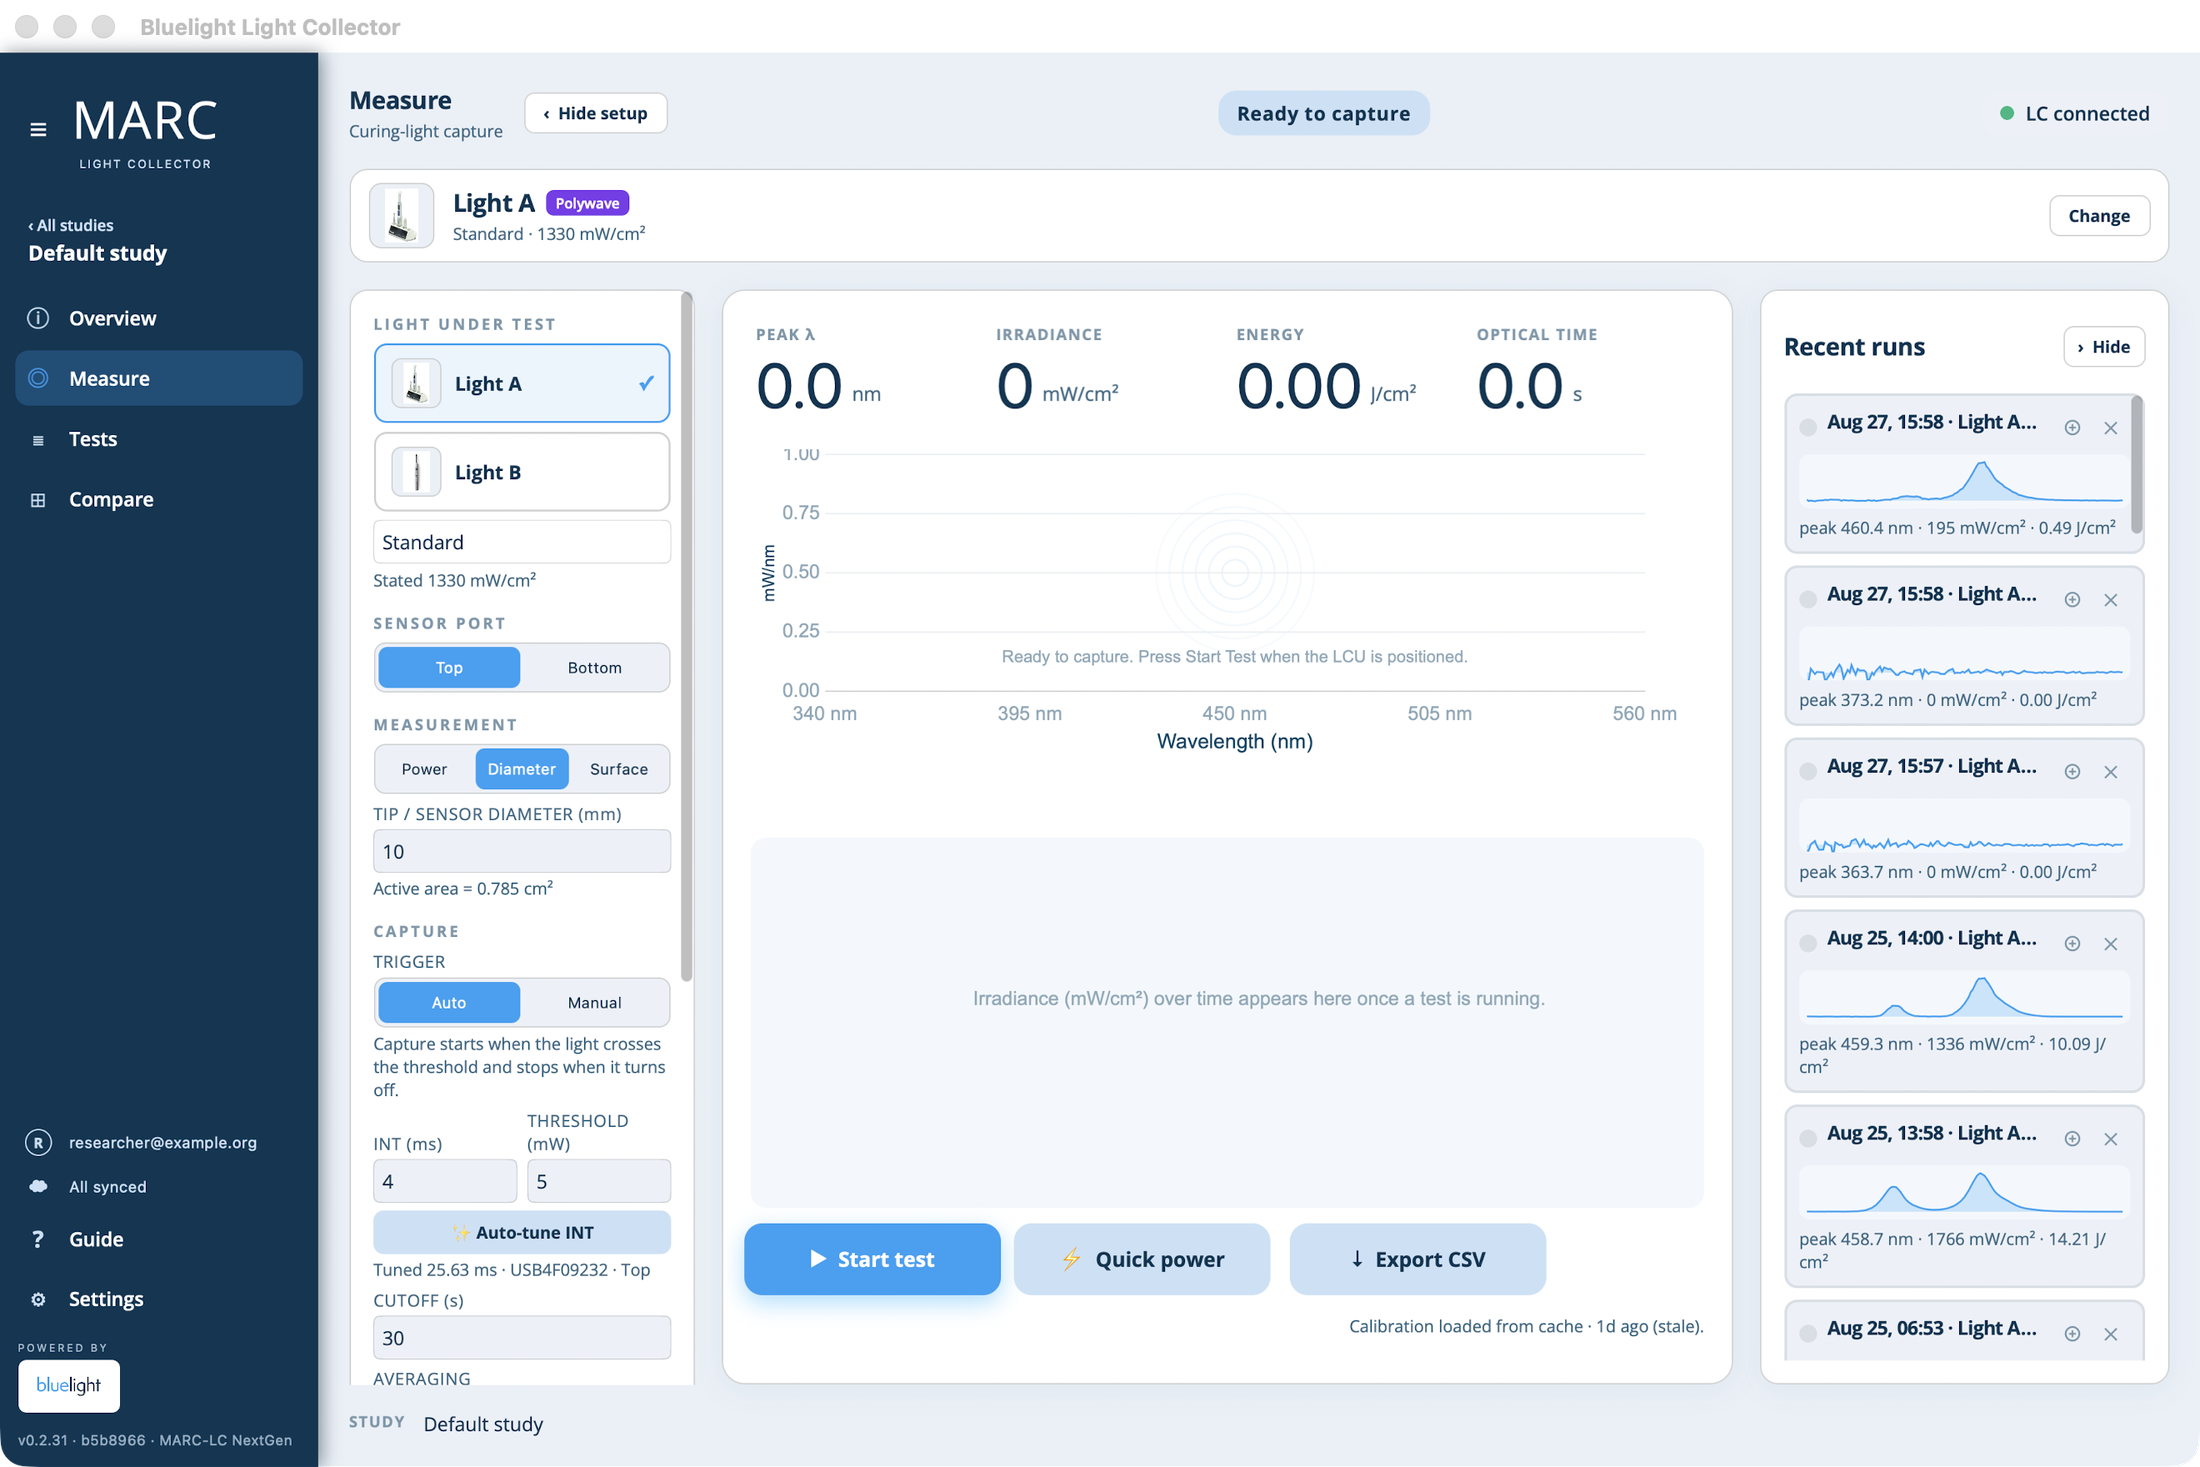
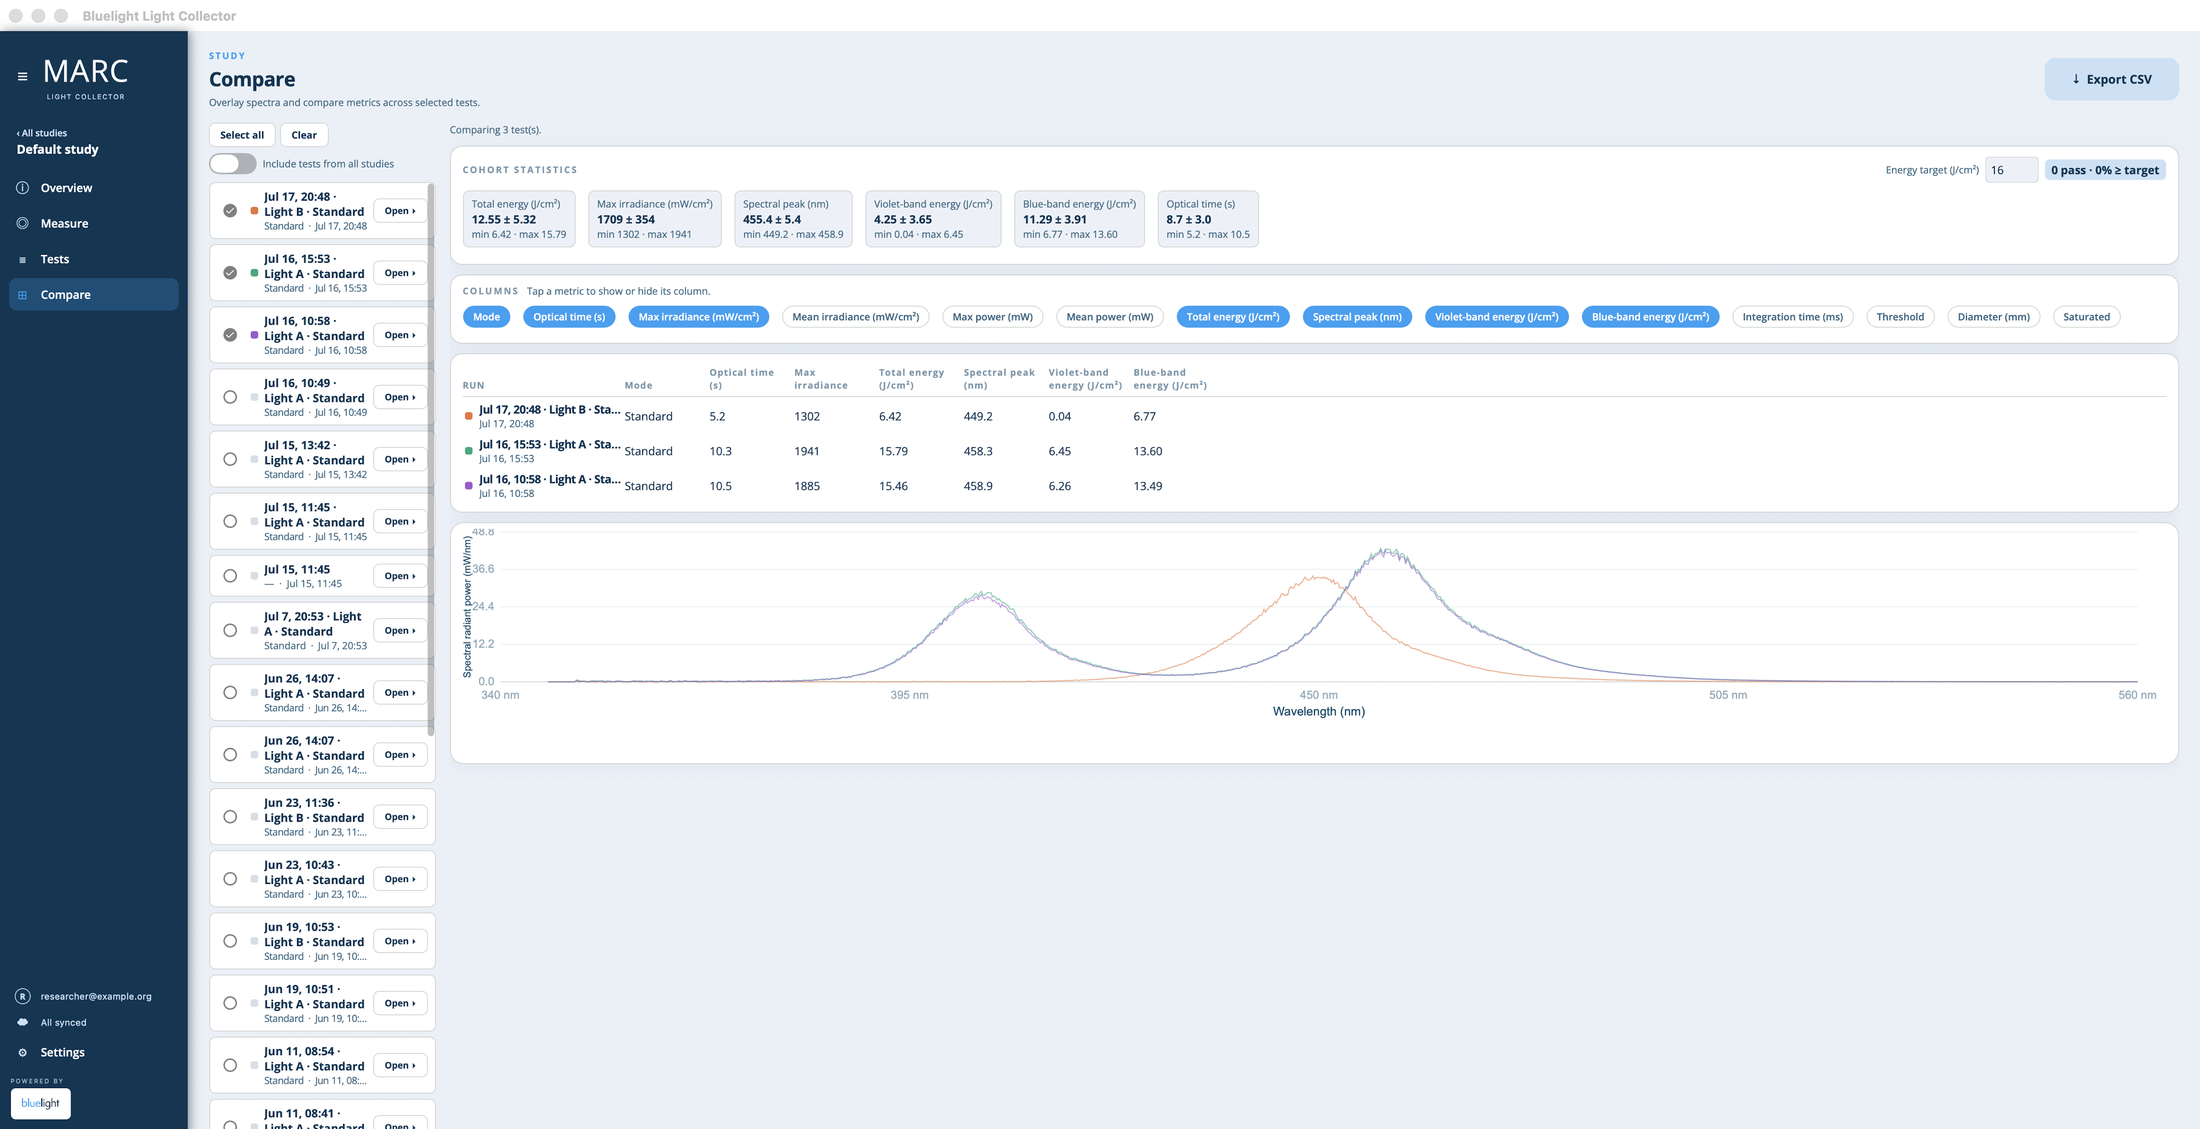
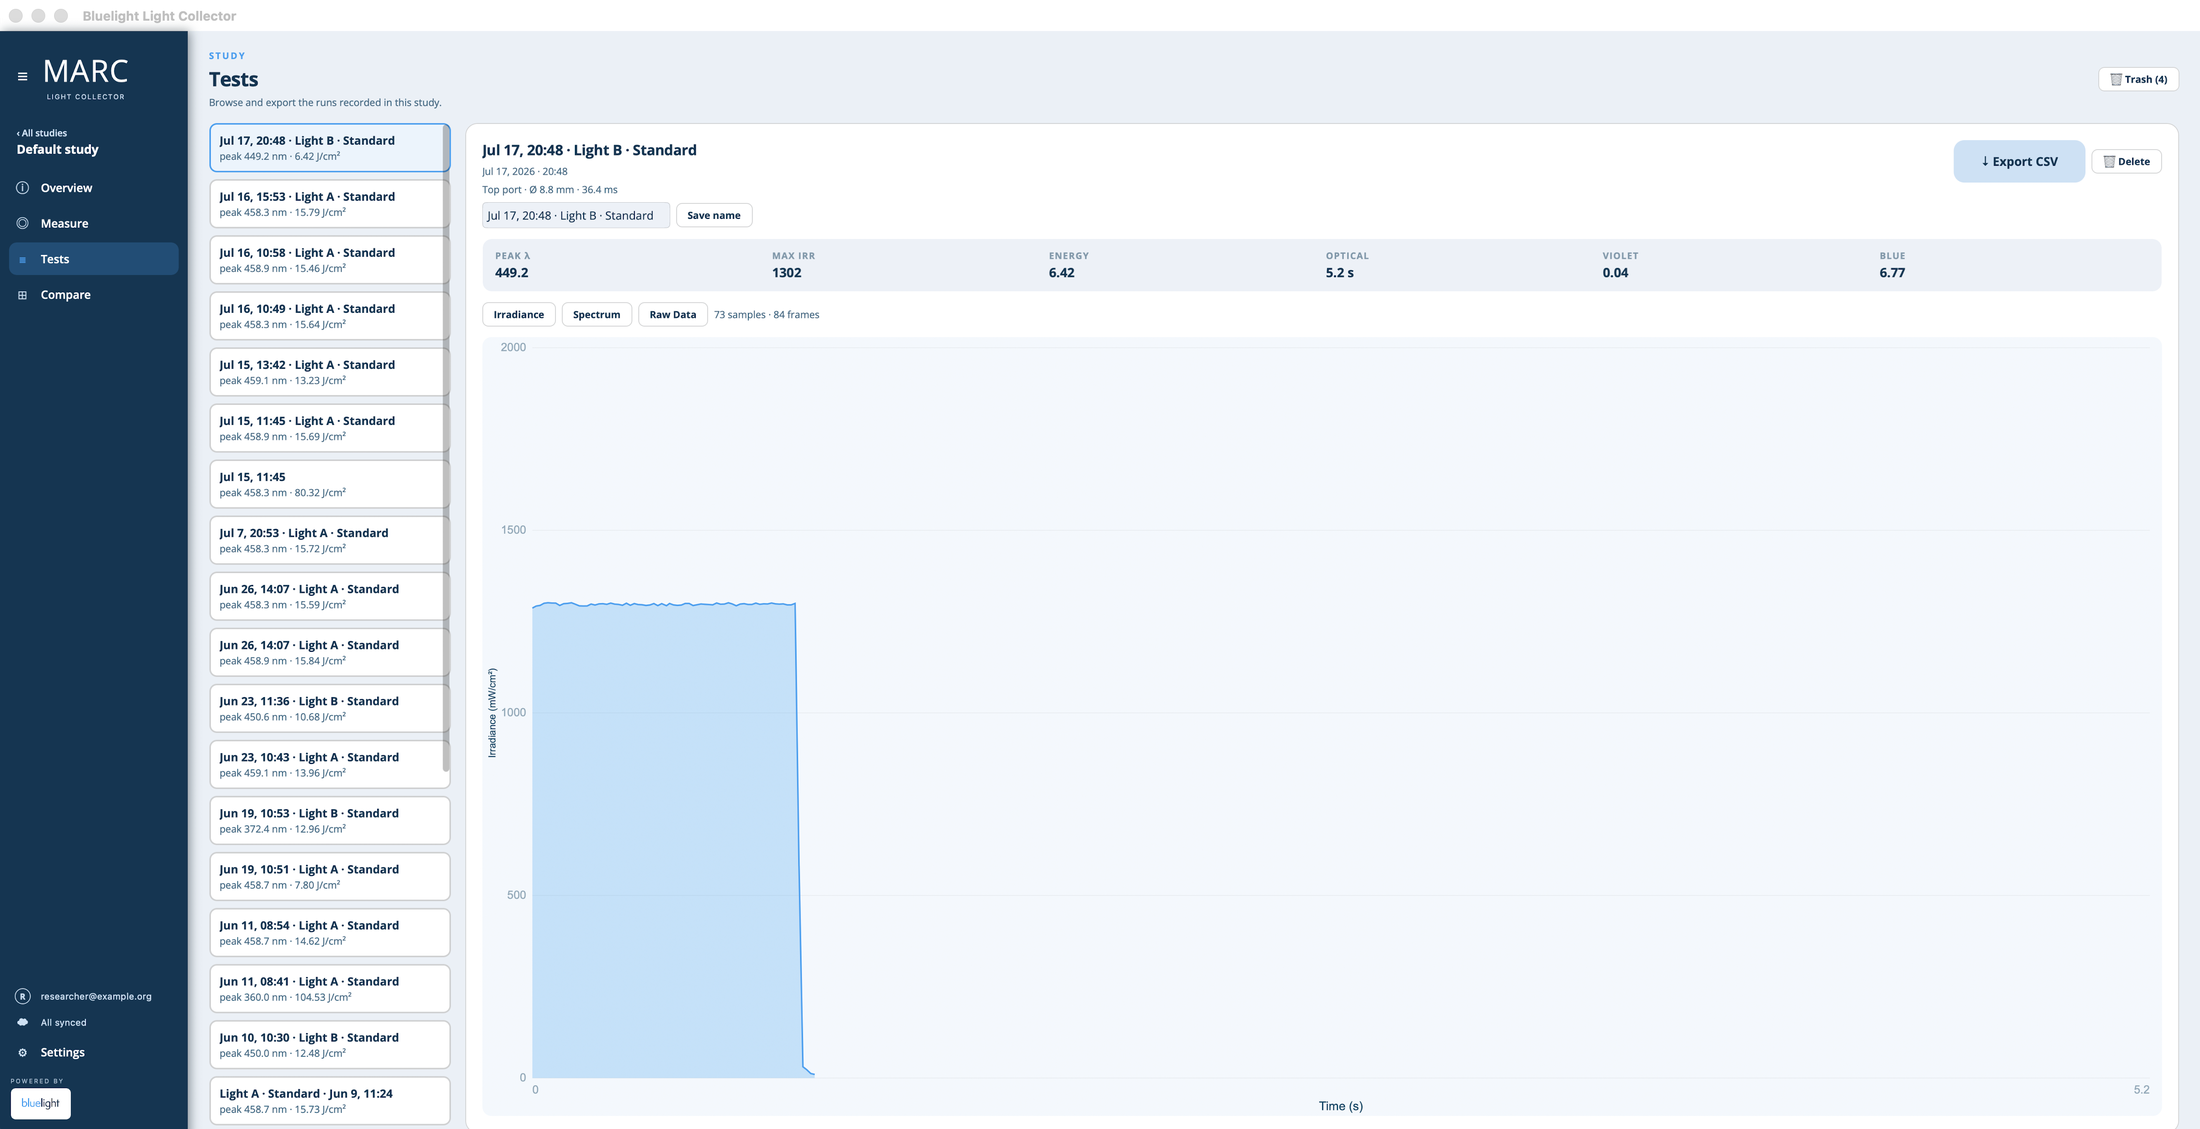
Every run, in full detail: per-test KPIs, the full spectrum, and exportable raw data (irradiance-over-time and per-wavelength).
Capture is armed by a configurable power threshold: recording begins when the light fires and ends when it turns off, so every capture spans exactly the light-on window.
Group tests into studies with energy and time targets and the lights under test; compare runs side by side with spectra overlaid and metrics per run.
Scrub back through a completed capture frame by frame, and trim a run to the exposure that matters.
Flagged live during capture and stored on the run, so a compromised measurement never hides inside a dataset.
Operator-set scan averaging and boxcar smoothing tame noisy sources without touching the raw record.
Studies, spectra, and full per-frame raw scans sync to secure cloud storage. Capture offline at the bench; sign in on another machine and your history is already there.
macOS & Windows · analysis-ready CSV export · every measurement carries its calibration, settings, and device identity
Specifications
The numbers a methods section needs.
How it measures
Total-flux geometry, to the ISO standard.
A planar, cosine-only sensor sees only what falls on its face. MARC-LC collects the total radiant flux: the collection geometry behind the radiometric test methods in ISO 10650:2026, and the reason integrating-sphere measurement is the accepted laboratory approach.
Turbo and wide tips fit the 16 mm port
Total-flux collection, cosine-corrected
Resolved by wavelength, 350 to 1,000 nm
mW/nm · mW/cm² · J/cm²
Measurement and reporting consistent with ISO 10650:2026 test methods · analysis-ready CSV export
Why a traceable reference matters
Handheld radiometer readings ranged from 7% to 535% of the laboratory reference.
A peer-reviewed study in PLOS ONE compared 16 handheld dental radiometer models against a laboratory-grade integrating-sphere reference across 38 curing lights. Individual readings ranged from 7% to 535% of the reference value: underestimating output by as much as 93%, and overestimating it by as much as 435%. Only one meter model averaged within roughly 20% of the reference. A chairside number is not a measurement of the light; it is a measurement of that meter, and the spread between meters is enormous.
That is the entire case for a traceable, spectrally resolved reference. It is why laboratory integrating-sphere instruments are the ground truth. In the same study, MARC-LC closely agreed with that reference: adjusted R² above 0.99, no significant difference in pooled mean power, and derived irradiance within about 0.8% of the reference. Its radiant-power measurements have also been used to convert camera images into absolute irradiance beam profiles.
What it's for
From a single baseline to a service-life endurance run.
The same instrument answers a formulation question on a manufacturer's bench and a method-validation question in an academic lab.
The evidence
18 peer-reviewed journal papers.
Every paper below names the MARC Light Collector in its own methods - verified against the primary text, not abstracts - and is grouped by what the instrument was used for. Each citation links to its DOI.
Measuring the curing light itself
Generated the reference table of peak wavelength, power, and irradiance across halogen, plasma, LED, and laser curing lights for a field review of light in dentistry.
Hadis, Shortall & Palin · Biomater Investig Dent · 2024
doi.org/10.2340/biid.v11.40308Its radiant-power measurements were used to convert camera images into absolute irradiance beam profiles (technical work with a Bluelight co-author).
Rocha, Oliveira, Felix, Roulet, Sinhoreti & Correr · Eur J Dent · 2022
doi.org/10.1055/s-0041-1731628Characterized a four-wavelength curing light against a conventional unit on irradiance, spectrum, and composite properties - research from the USAF Postgraduate Dental School.
Adams, Savett, Lien, Raimondi & Vandewalle · J Clin Exp Dent · 2022
doi.org/10.4317/jced.59825Measured dental-headlight spectra across 360 to 800 nm, showing that blue-light emission from headlights can prematurely polymerize light-cured composites and shorten working time.
Rocha, Ottenga, Zoidis, Pontes, Reis & Oliveira · J Clin Exp Dent · 2022
doi.org/10.4317/jced.59628
Measuring what passes through the material
Rapid curing of bulk-fills: real-time transmission at 2 and 4 mm on both sensors, violet and blue analyzed separately, on the MARC accessory bench.
Marović, Par, Daničić et al. · Int J Mol Sci · 2025
doi.org/10.3390/ijms26062803Two cosine-corrected sensors read top and bottom irradiance through graphene-modified orthodontic retainer adhesives during cure.
Liu, El-Angbawi, Ji, Rosa & Silikas · Eur J Oral Sci · 2024
doi.org/10.1111/eos.12966Blue vs red transmission through lithium-disilicate ceramic: three translucencies, three shades, six thicknesses - red penetrates significantly better.
Lencioni, Lamoutte, Pereira, Rocha & Oliveira · J Esthet Restor Dent · 2026
doi.org/10.1111/jerd.70171Light attenuation through surface-treated CAD-CAM lithium-silicate glass ceramics, specimens centered on the bottom sensor.
Al-Johani, Haider, Silikas & Satterthwaite · Dental Materials · 2023
doi.org/10.1016/j.dental.2023.07.004Transmitted irradiance through repeatedly fired fully crystallized lithium-silicate ceramics.
Al-Johani, Haider, Silikas & Satterthwaite · J Prosthet Dent · 2024
doi.org/10.1016/j.prosdent.2024.01.006Per-millimetre light transmittance and ISO 4049 depth of cure of a bulk-fill under the exposure-reciprocity law at an equalized 20 J/cm².
Rocha, Roulet, Sinhoreti, Correr & Oliveira · Braz Dent J · 2021
doi.org/10.1590/0103-6440202103842Irradiance transmittance of clear PVS injection-moulding materials from 2 to 10 mm thickness.
Machado, Rocha, Oliveira, Reardon, Martins & Lawson · J Esthet Restor Dent · 2025
doi.org/10.1111/jerd.13270
Trusted as the calibrated reference
Verified 3-second high-irradiance curing protocols to within ±10%, sampling 360 to 540 nm, before degree-of-conversion testing.
Algamaiah, Alshabib, Algomaiah, Yang & Watts · Dental Materials · 2024
doi.org/10.1016/j.dental.2024.08.008Characterized the curing units behind rapid-cure and ageing work on translucency-shift bulk-fill composites.
Marović, Par, Mandic et al. · Materials · 2025
doi.org/10.3390/ma18245613Verified radiant emittance before every specimen in hygroscopic testing of nano-ZnO resin composites.
Alayed, Silikas & Watts · Eur J Oral Sci · 2025
doi.org/10.1111/eos.70029Verified emittance for hydrolytic-degradation testing of giomer and fluoride-releasing bulk-fill composites.
Aldhafyan, Khan, Saeed, Al-Odayni et al. · ACS Omega · 2025
doi.org/10.1021/acsomega.5c00784Top-sensor verification behind flexural, roughness, sorption, and colour-stability testing of commercial bulk-fills.
Almulhim, Alghamdi, Alqahtani et al. · Dentistry Journal · 2026
doi.org/10.3390/dj14020117Verified radiant emittance in colour-stability and hardness work under GERD-like acid conditions.
AlQahtani · Saudi Dental Journal · 2025
doi.org/10.1007/s44445-025-00095-y
Independently validated
Independently benchmarked against a Labsphere integrating-sphere gold standard - University of Birmingham, no Bluelight author: adjusted R² above 0.99, no significant difference in pooled mean power, derived irradiance within ~0.8% of the reference.
Shortall, Hadis & Palin · PLOS ONE · 2021
doi.org/10.1371/journal.pone.0245830
Plus a ConsEuro 2021 conference abstract (Üçtaşlı et al., University of Turku & University of Eastern Finland). Counts cover journal papers whose methods explicitly name the Light Collector; 200+ peer-reviewed publications involve the wider MARC platform. Browse the full research index →
Onboarding & documentation
A user guide that matches your build
The user guide is generated with each release and bundled inside the app, so the documentation always describes the software you're actually running.
Getting a clean measurement
Plain-language guidance on exposure tuning, scan averaging, and smoothing: how to set the instrument up so the first capture is a defensible one.
Research-team support
Onboarding, calibration, and method support from the team behind the instrument, from study design through publication.
The MARC family
Products for one curing step.
Every Bluelight product measures the same clinical step, the cure, at a different altitude. MARC-LC is the research reference at the top of that stack.
Expert field audit of every light
for Dentists & DSOs
The light, and energy through materials
for Academic researchers & manufacturers
The operator's technique
for Dental schools
Running a MARC Resin Calibrator?
Your RC upgrades to the MARC-LCPut the laboratory reference on your bench.
MARC-LC is sold as a quoted instrument with onboarding and research-team support. Tell us about the work and we'll plan the instrument and the study design around it. Or bring us the question, and our laboratory runs the study for you.