For manufacturers / Laboratory testing
Independent laboratory testing for curing lights and light-cured materials.
Manufacturers bring us two kinds of questions: what does our light actually deliver? and what should our instructions for use say? We answer both the same way: with measurement. We report measurements; we don't provide endorsements. That independence is what makes the data usable in regulatory submissions, marketing claims, and peer-reviewed publication.
- 200+Peer-reviewed publications involving the MARC platform
- 18Journal papers naming the MARC Light Collector
- 2009Deployed worldwide since
- 350 to 1,000 nmSpectral range, visible to infrared
Regulatory submissions · Dental curing lights
Every output measurement a curing‑light 510(k) file needs, from one laboratory.
FDA's final guidance (September 2, 2026) lists six output measurements. We make all six and deliver the report.
Leave it to us
You don't need to become a curing‑light photometry lab to file. Send us the light; we return the optical‑performance section, measured, plotted and written up the way FDA's bench‑testing guidance recommends, ready for your regulatory team or consultant to drop into the file. We'll talk to your consultant directly if that is easier.
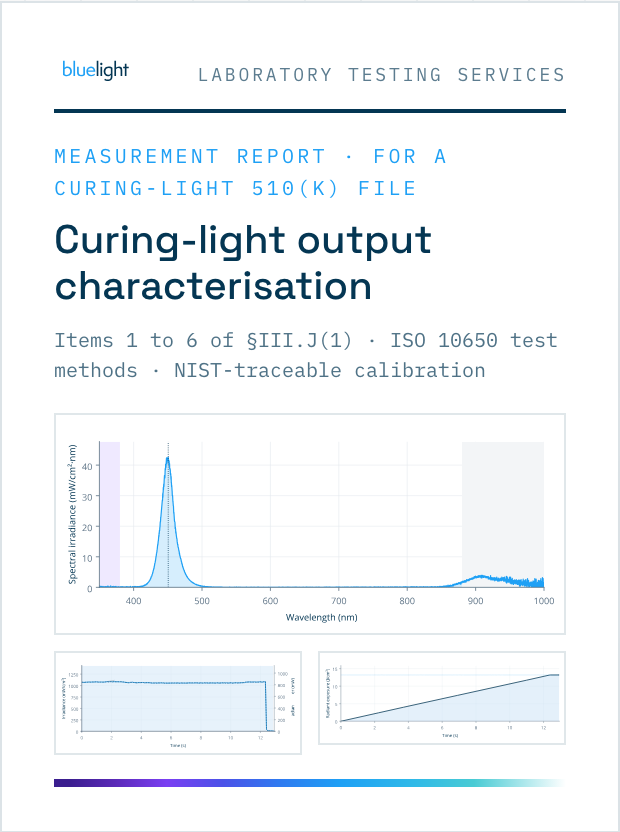
What you receive: the report, the protocol, the data, the calibration record, the plots.
The six measurements
 01Total radiant power through the exposure cycle
 02Maximum irradiance at the light‑guide tip
 03Spectral plot with the peak wavelength and any output below 380 nm
 04Radiant exposure for each curing mode
 05Irradiance attenuation from 0 to 10 mm
 06Beam profile of the tip, on our laboratory profiler
All six, one laboratory, one report.
We report measurements; we don't provide endorsements. That independence is what makes the data usable in a submission.
In FDA's words: Section III.J(1), quoted verbatimfda.gov/media/74206/download
“Total radiant power output (or radiant flux) (mW) throughout the total exposure cycle;”
“Maximum light intensity (or irradiance) (mW/cm2) measured at the distal end (tip) of the device light guide;”
“Total spectral irradiance (mW/cm2 • nm-1) plot at maximum irradiance output (mW/cm2) versus wavelength (nm) at the tip of the device light guide showing the peak wavelength (nm) and ultraviolet wavelengths (i.e., < 380 nm);”
“Radiant exposure (or optical radiation dose) output range (J/cm2) calculated by multiplying irradiance (mW/cm2) outputs of the various curing modes by recommended curing times (s);”
“Irradiance attenuation plot, which is the irradiance (mW/cm2) versus vertical distance (from 0 mm to 10 mm at 2 mm increments) from the device light guide tip; and”
“Thermal image or beam profiler of cross section of light guide tip at maximum radiant exitance showing relative 'hot' and 'cold' spots across lateral surface of the device light guide tip.”
FDA, Dental Curing Lights – Premarket Notification (510(k)) Submissions, September 2, 2026, §III.J(1).
The light, its curing modes, the items you need, your filing date.
Fixed scope and a fixed quote, agreed before any measurement is made.
Samples come to our laboratory in Halifax, Canada.
NIST‑traceable calibration · Supports ISO 10650:2026 test methods · 18 journal papers naming the MARC Light Collector · Since 2009
The catalogue
What we test.
Power and irradiance
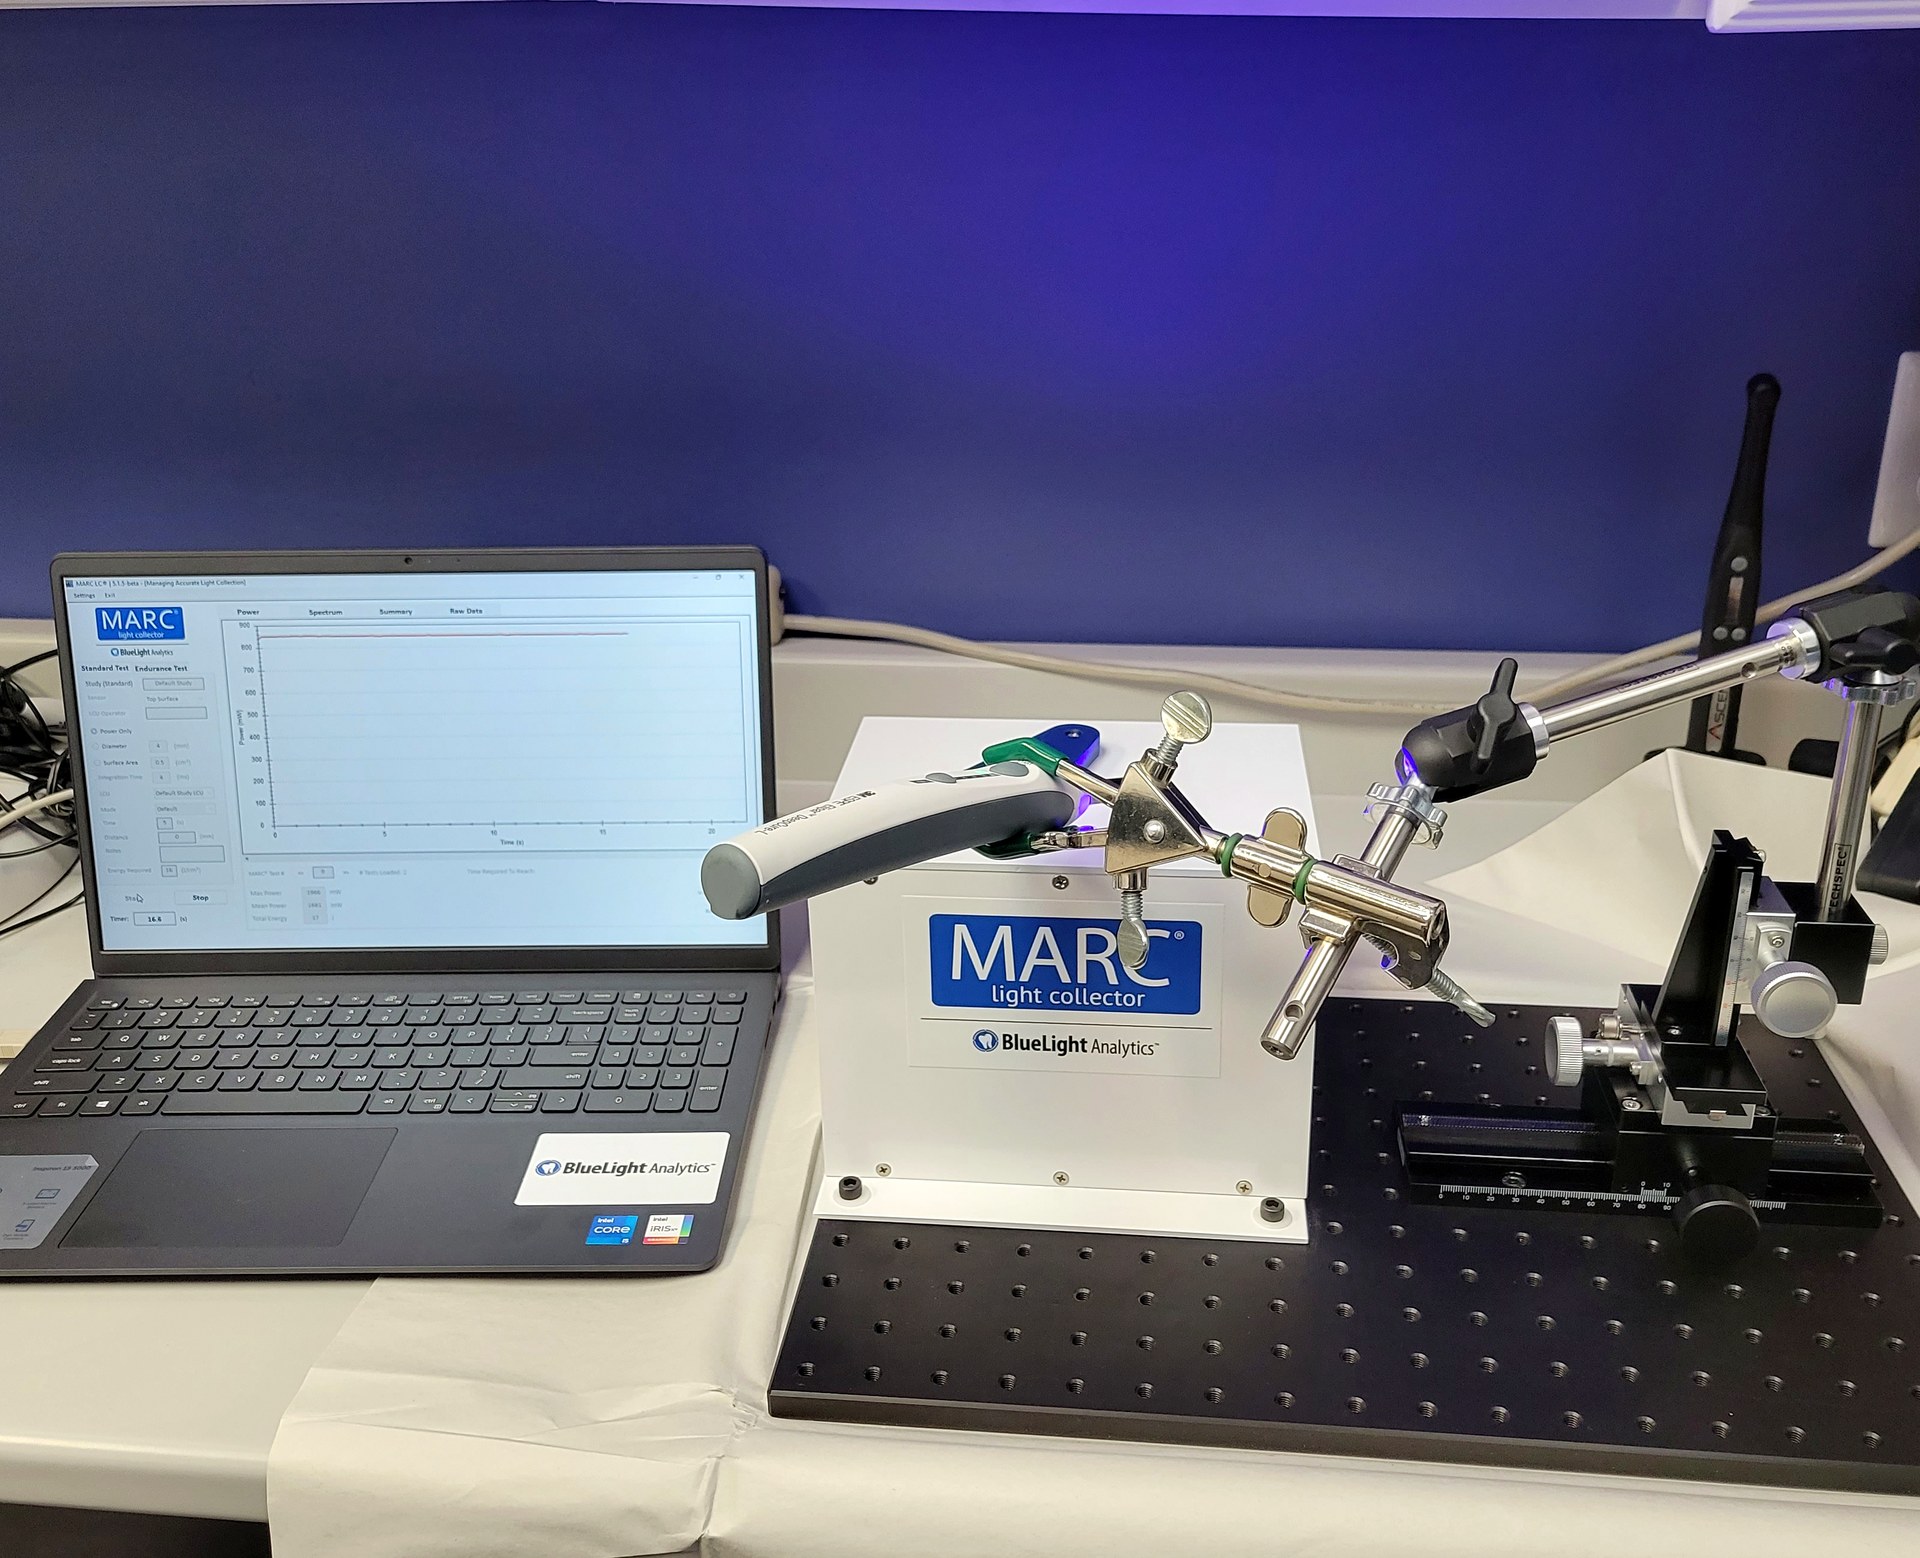
Total power output on a laboratory integrating sphere; tip irradiance derived from optically measured active area; supports ISO 10650:2026 test methods. Sampling fast enough to resolve short, high-intensity exposure modes. Radiant exposure (J/cm²) reported per curing mode, from tip irradiance and the recommended exposure time.
Spectral characterization and photoinitiator efficiency
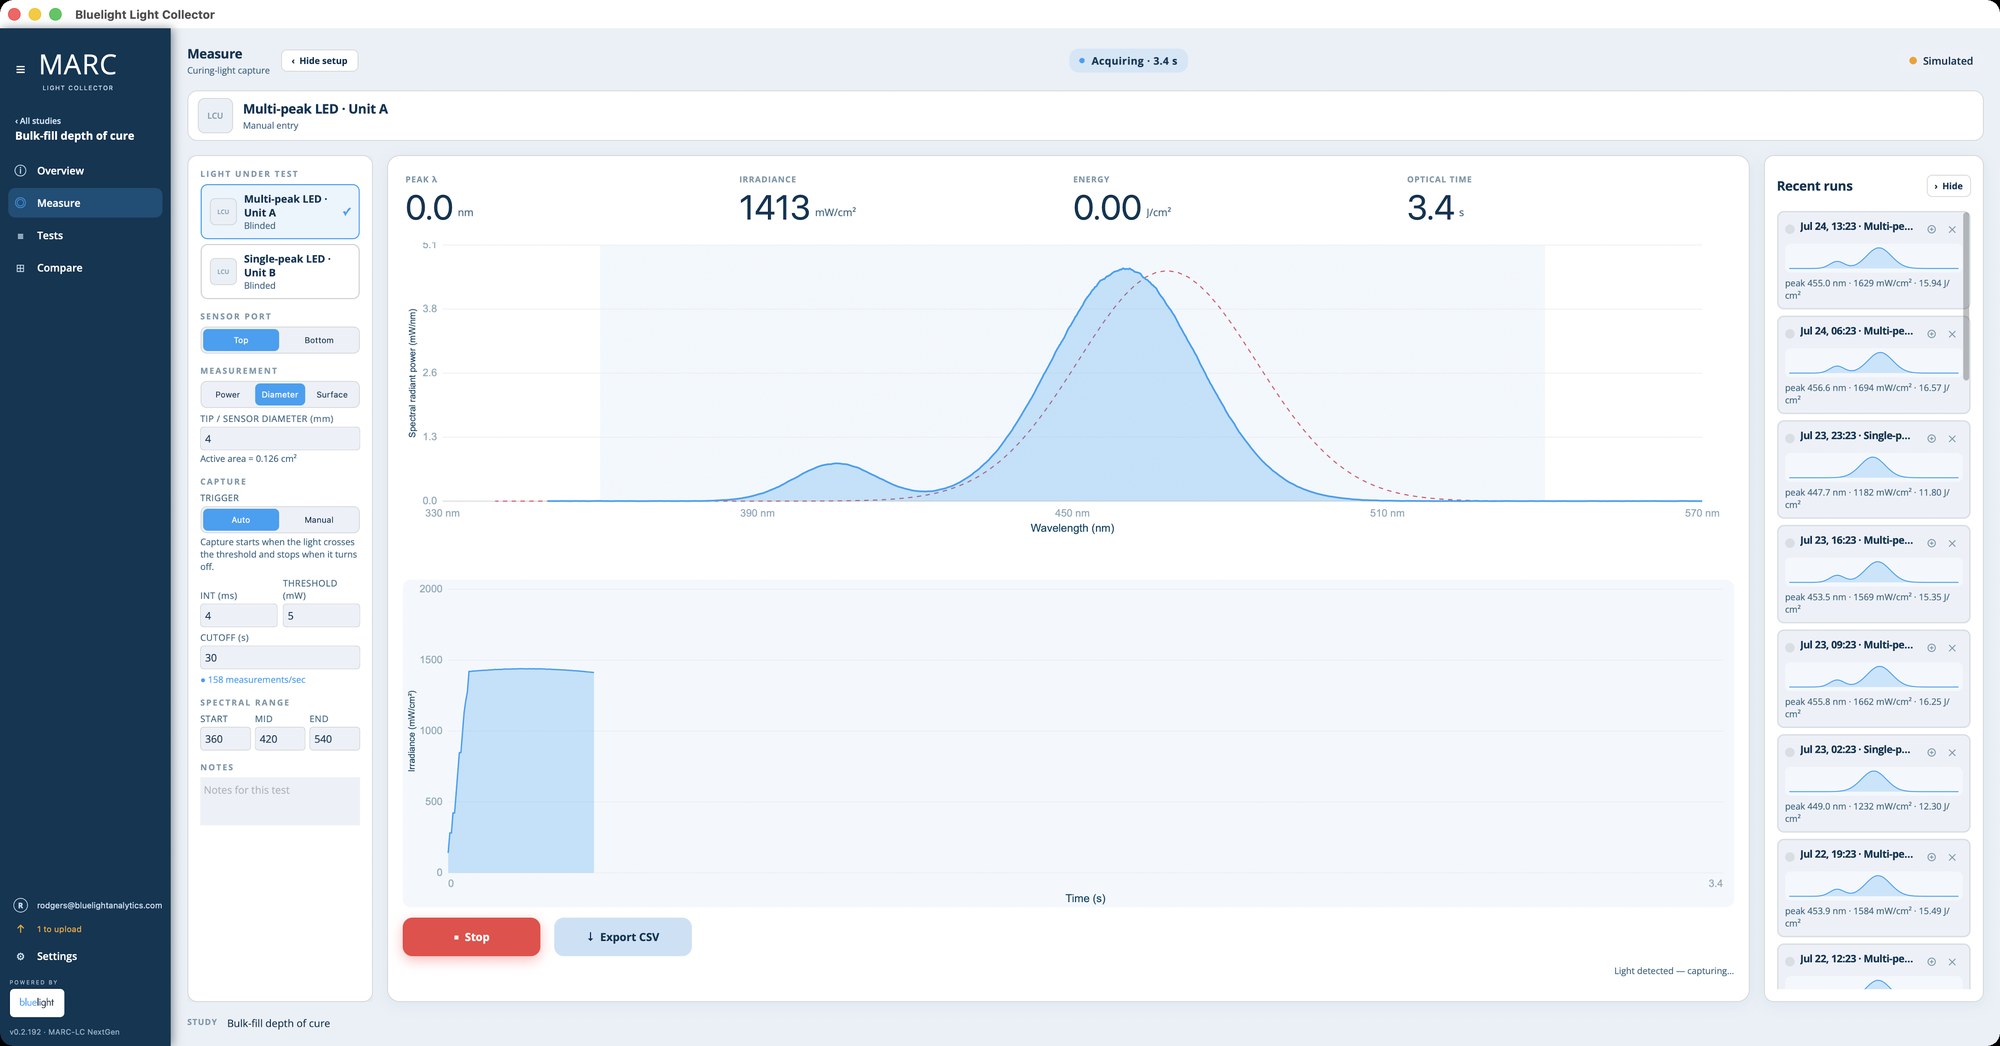
Spectral radiant power across 350 to 1,000 nm, plotted with the peak wavelength and any output below 380 nm, with multi-wave LED bands resolved separately. We convolve your light's emission with photoinitiator absorption to report CQ and TPO efficiency (the fraction of your light's power the chemistry can actually use) and the effective power available to each photoinitiator.
Irradiance at clinical distance
Output measured from contact to 10 mm in 1 mm steps through a calibrated nine-aperture series (3 to 11 mm), quantifying collimation and what the light delivers at the working distances restorations are actually cured at.
Beam profiling
Laser-beam-analyzer irradiance maps across the active area, with uniformity metrics including the industry-standard Top Hat Factor, plus Bluelight's own Hot/Cold Ratio and Clinical Variability Ratio analyses: hot-spot and cold-spot behaviour at the 4 mm scale of a typical restoration.
Thermal performance
Surface temperature rise at the tip, and pulp-chamber temperature in an instrumented natural tooth under simulated intraoral conditions: the safety half of a high-output claim.
Endurance and battery
Automated repeated-cycle protocols: output stability across cure cycles and full battery-drain behaviour, with per-cycle spectral data.
Depth of cure: one of the ISO 4049 test methods
One of several tests ISO 4049 specifies for polymer-based restoratives: material packed into the specified mold and irradiated per your instructions for use; all uncured material is scraped away, and the height of the remaining solid is halved. The result must support the depth your IFU states, within the standard's tolerance: the test behind every stated depth-of-cure claim.
Instructions-for-use development
Our transmission-guided protocol measures per-wavelength light transmission across every shade of a composite line and anchors it with depth-of-cure testing. Because beam hot spots make delivered energy differ from a light's nominal output, we measure the irradiance and total energy actually delivered into the 4 mm specimen directly. The result: the shade-group, increment, and cure-time tables your IFU states, traced to measured delivered energy, not estimation.
| Shade group | Max increment | Irradiance range 1 | Irradiance range 2 |
|---|---|---|---|
| Group A (high transmission) | 2.0 mm | t₁ s | t₂ s |
| Group B (median) | 2.0 mm | t₃ s | t₄ s |
| Group C (opaque / low) | 1.5 mm | t₅ s | t₆ s |
The process
How an engagement works.
A short call to define your objectives and the claims the data must support.
A written protocol, sample requirements, and a fixed quote.
You ship samples; we run the protocol.
Complete datasets in open formats. NIST-traceable calibration.
A short call defines your objectives and the claims the data must support. We write a specific protocol with sample requirements and a fixed quote. You ship device samples, and materials if the study calls for them. We run the protocol and deliver a report with complete datasets in open formats (CSV, Excel, PDF; mW/nm, mW/cm², J/cm²). Instrument calibration is NIST-traceable. If publication is a goal, we design to publication standards from the start, typically partnering with a university research group.
Beyond services
Your own reference instrument.
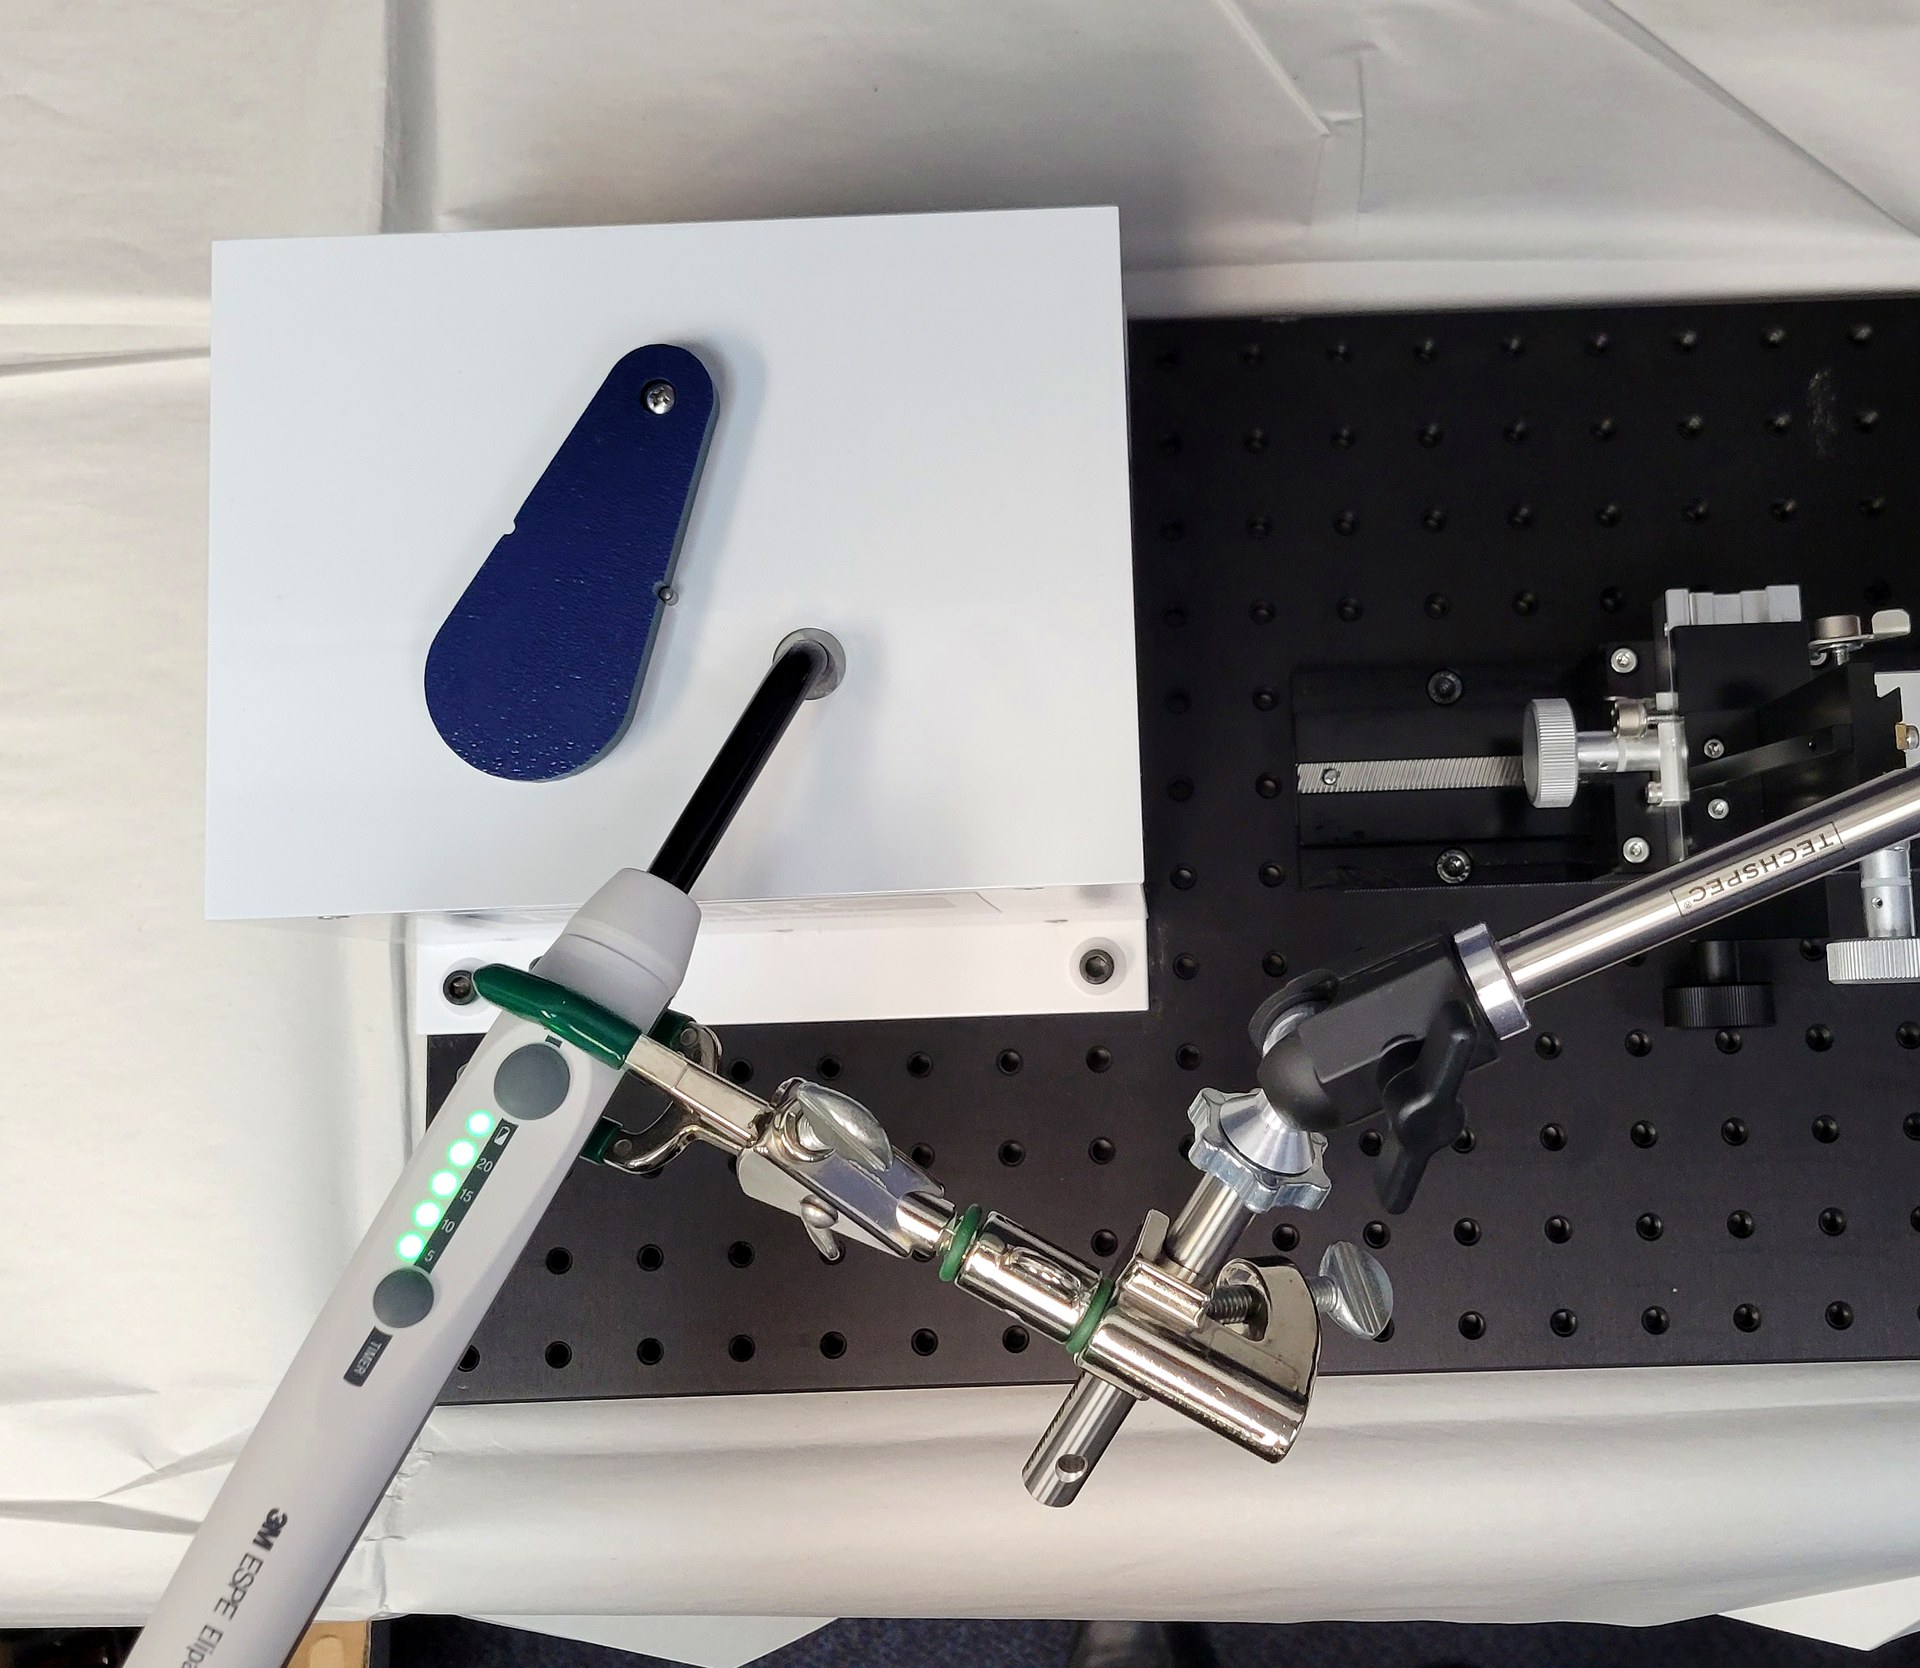
Several manufacturers run a MARC Light Collector in their own facilities, for R&D characterization during development and on the production line as a reference instrument for output verification and batch QC, confirming that shipped units deliver their specified irradiance and spectrum. The MARC-LC is sold as a quoted instrument; purchase includes team onboarding, study-design support, software, and technical support from Halifax. Calibration by Bluelight is available as a paid service on request; laboratory testing is performed on instruments Bluelight calibrates.
Questions
Frequently asked.
- Can Bluelight run ISO 4049 depth of cure testing?
- Yes. Depth of cure, following the ISO 4049 method, is one of our laboratory services, with the irradiance and total energy delivered into the 4 mm specimen measured directly. We report measurements; we don't provide endorsements.
- Is Bluelight's instrumentation traceable?
- Instrument calibration is NIST-traceable, and the MARC-LC supports ISO 10650:2026 test methods.
- Does the MARC-LC produce all six measurements FDA's guidance lists?
- Five. The beam profile is produced in our laboratory on a camera-based beam profiler, not on the MARC-LC. The other five are spectroradiometric measurements the MARC-LC makes.
Tell us what you're testing.
Tell us what the data needs to support (a regulatory submission, a marketing claim, an IFU, a publication), and we'll come back with a specific protocol and a fixed quote.